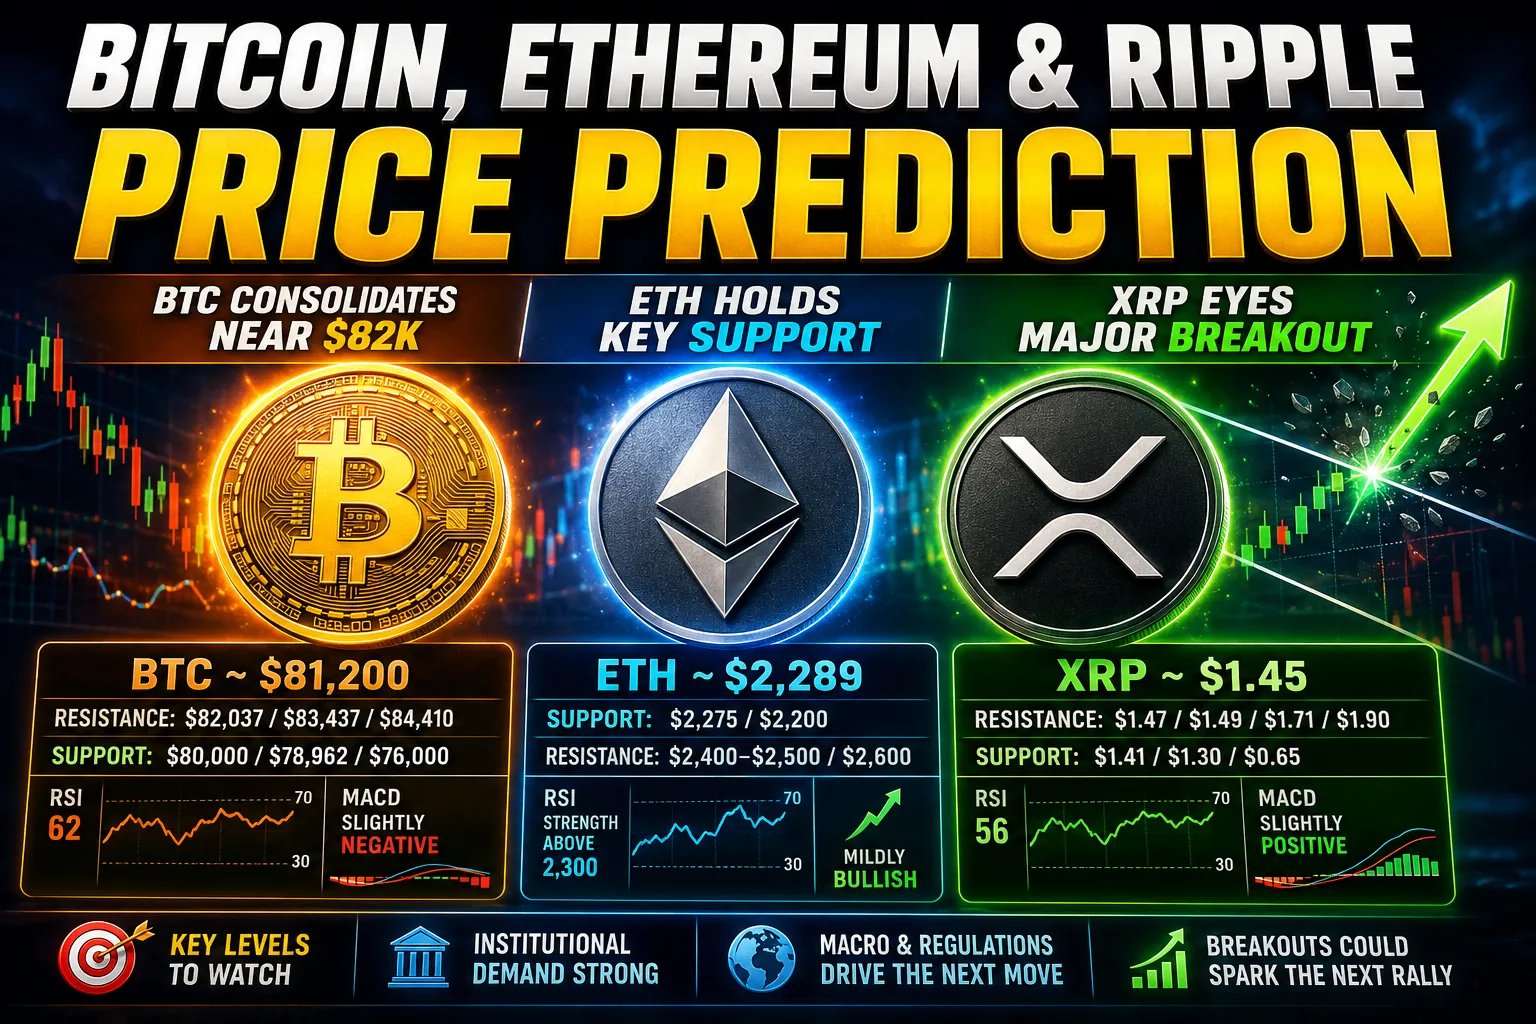
Bitcoin, Ethereum, and Ripple Price Prediction: BTC Consolidates Near $82K, ETH Holds Key Support, XRP Eyes Major Breakout
The top three cryptocurrencies — Bitcoin (BTC), Ethereum (ETH), and Ripple (XRP) — are currently navigating through critical technical levels that could define the next major price move. While Bitcoin continues to consolidate below a key resistance zone, Ethereum is finding solid footing above an important support level, and XRP is quietly building pressure for what could be a significant breakout. Here is a detailed breakdown of where each coin stands technically and what traders should watch closely.
Bitcoin (BTC) Price Prediction: Consolidation Below the 200-Day EMA
BTC Key Technical Levels
- Current Price: ~$81,200
- Key Resistance: $82,037 (200-day EMA), $83,437 (61.8% Fibonacci), $84,410 (horizontal resistance)
- Key Support: $80,000 (psychological level), $78,962 (50% Fibonacci retracement), $76,000–$76,735 (50-day and 100-day EMAs)
- RSI: Around 62 — bullish momentum present but not yet overbought
- MACD: Slightly negative — suggests a brief pause before the next leg up
What Could Push BTC Higher?
Ethereum (ETH) Price Prediction: Finding Strong Footing at the 50-Day EMA

ETH Key Technical Levels
- Current Price: ~$2,289
- Key Support: $2,275 (50-day EMA), $2,200 (structural support)
- Key Resistance: $2,400–$2,500 zone, $2,600 (next major barrier)
- RSI: Showing renewed strength above 2,300 levels
- Overall Bias: Mildly bullish with improving momentum
ETH Fundamental Outlook
Ripple (XRP) Price Prediction: Eyeing a Channel Breakout
XRP Key Technical Levels
- Current Price: ~$1.45
- Key Resistance: $1.47 (channel upper boundary), $1.49 (100-day EMA), $1.71 (200-day EMA), $1.90 (horizontal resistance)
- Key Support: $1.41 (50-day EMA), $1.30 (horizontal floor), $0.65 (channel bottom — only if major supports fail)
- RSI: Around 56 — positive but not stretched
- MACD: Slightly positive — improving buying pressure
What Happens If XRP Breaks Out?
Overall Crypto Market Outlook: Cautious Optimism
Key Themes to Watch
- Bitcoin ETF Flows: Continued institutional inflows into spot BTC ETFs would support prices and could be the trigger for a breakout above $82,000.
- Macro Environment: Interest rate expectations and broader risk sentiment in global markets continue to influence crypto prices. Any shift toward a more risk-on environment benefits BTC, ETH, and XRP.
- Regulatory Developments: Positive news on crypto regulation, especially for XRP and its ongoing legal battles, can spark sharp rallies.
- Technical Breakouts: Watch for BTC above $82,037, ETH above $2,500, and XRP above $1.47 as the key confirmation signals for bulls.
Summary: BTC, ETH, and XRP at a Glance
More from ArticlePaid

⚽ FIFA World Cup 2026 (USA, Canada, & Mexico) The historic worldcup
⚽ FIFA World Cup 2026 (USA, Canada, & Mexico) The historic 48-team World Cup has reached its fever pitch. After a frantic mo...

Geopolitics & Crisis (The Strait of Hormuz Incident)
⚖️ The Birthright Citizenship StandoffThe Supreme Court’s 6–3 ruling in Trump v. Barbara (issued in late June 2026) dealt a major ...
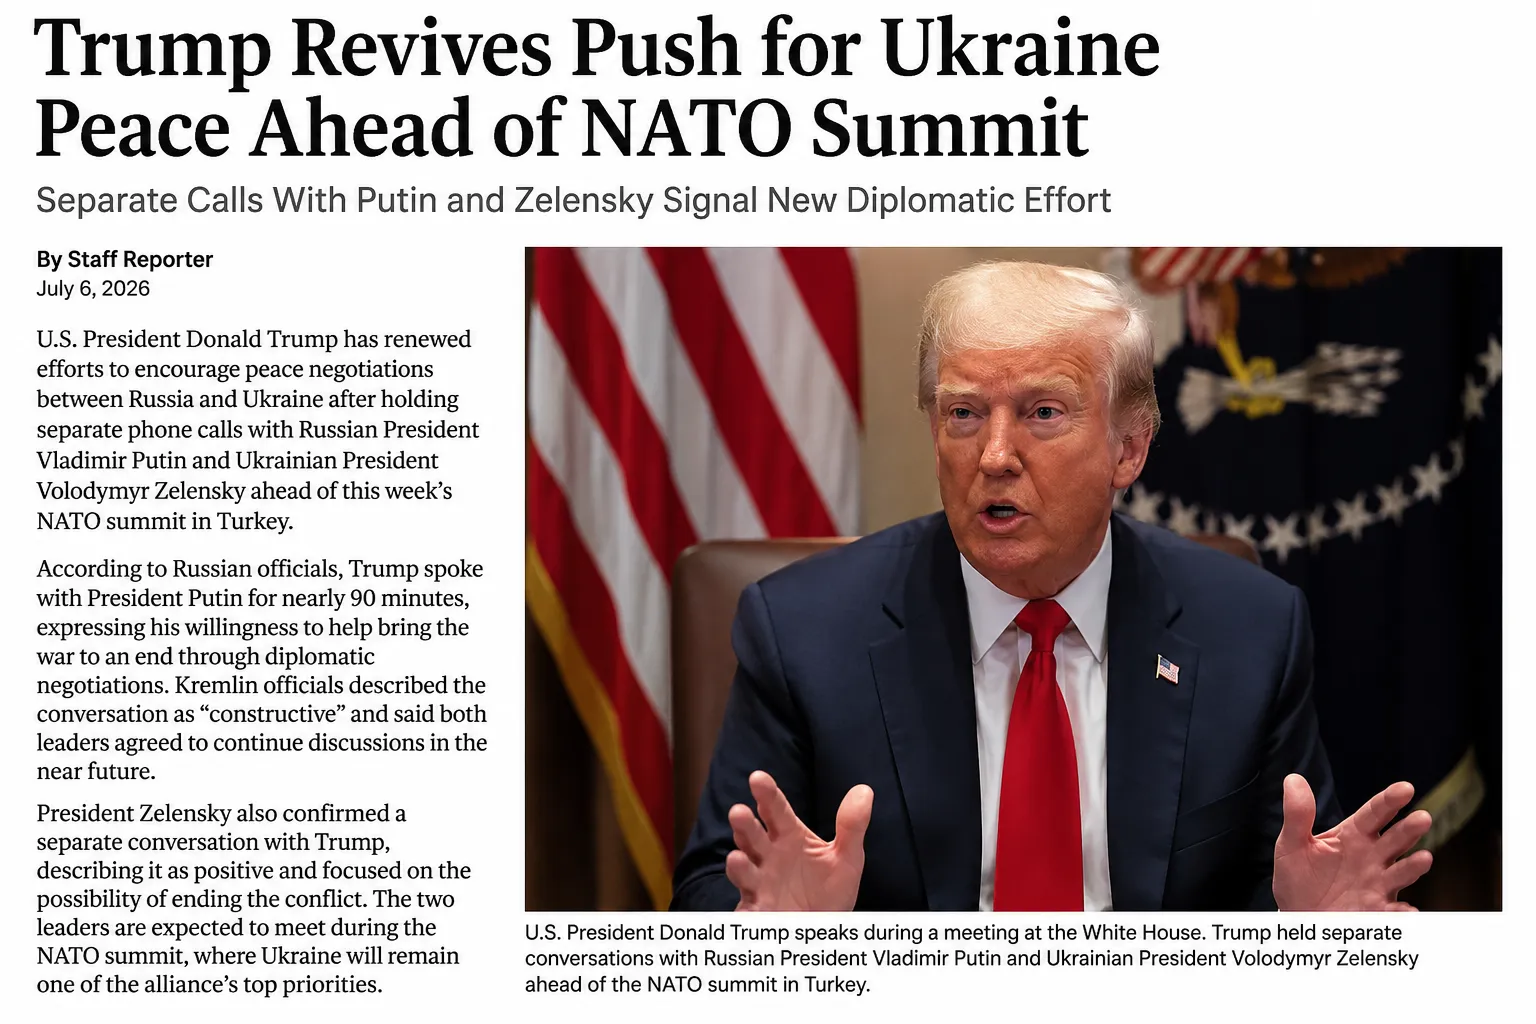
Trump Revives Push for Ukraine Peace Ahead of NATO Summit
As world leaders prepare to gather for this week's NATO summit, U.S. President Donald Trump has once again placed the Ukraine war ...
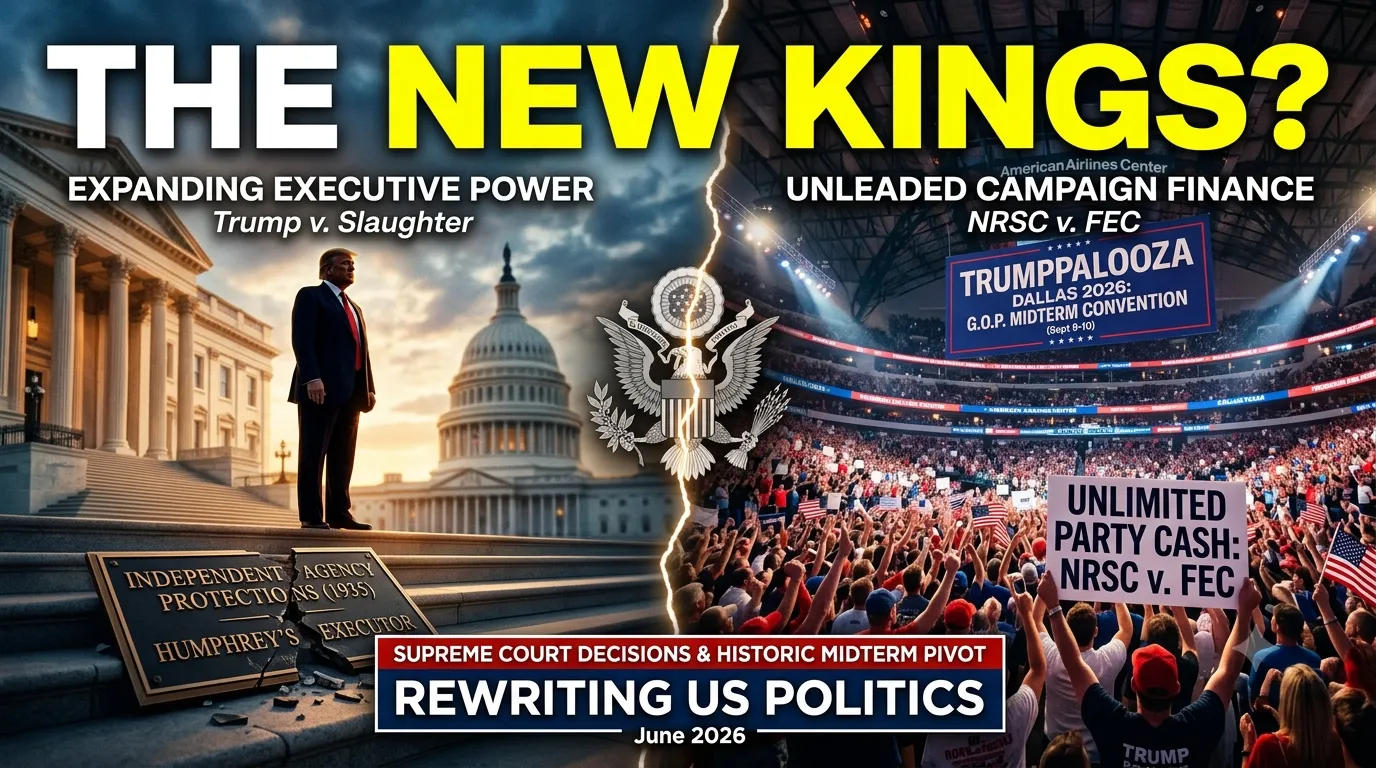
# The Imperial Presidency: How Supreme Court and a Historic Midterm rewrite
# The Imperial Presidency: How the Supreme Court and a Historic Midterm Pivot Are Rewriting US PoliticsThe landscape of American g...

A £300 Billion Pivot: Inside the UK's Defense Push Amid Leadership Chaos
The sudden announcement of Prime Minister Keir Starmer’s resignation on June 22, 2026, has thrown Westminster into a period of int...
10 Tectonic Shifts Rewriting the Global Power Map Right Now. Must read
Here is a structured overview of the major global political affairs and high-stakes developments currently defining international ...

What US Government Declassified Files Reveal About UAPs & Alien Classifications
For decades, if you wanted to talk about UFOs, you had to be prepared for a specific kind of reaction: a polite smile, a rolled ey...

The cupboard is really that bear
For decades, Pakistan's cricket team was famed for having premium fast bowlers. That means the 1992 ODI World Cup winners would ha...
Responses (0)
Sign in to share your thoughts.
Sign in