
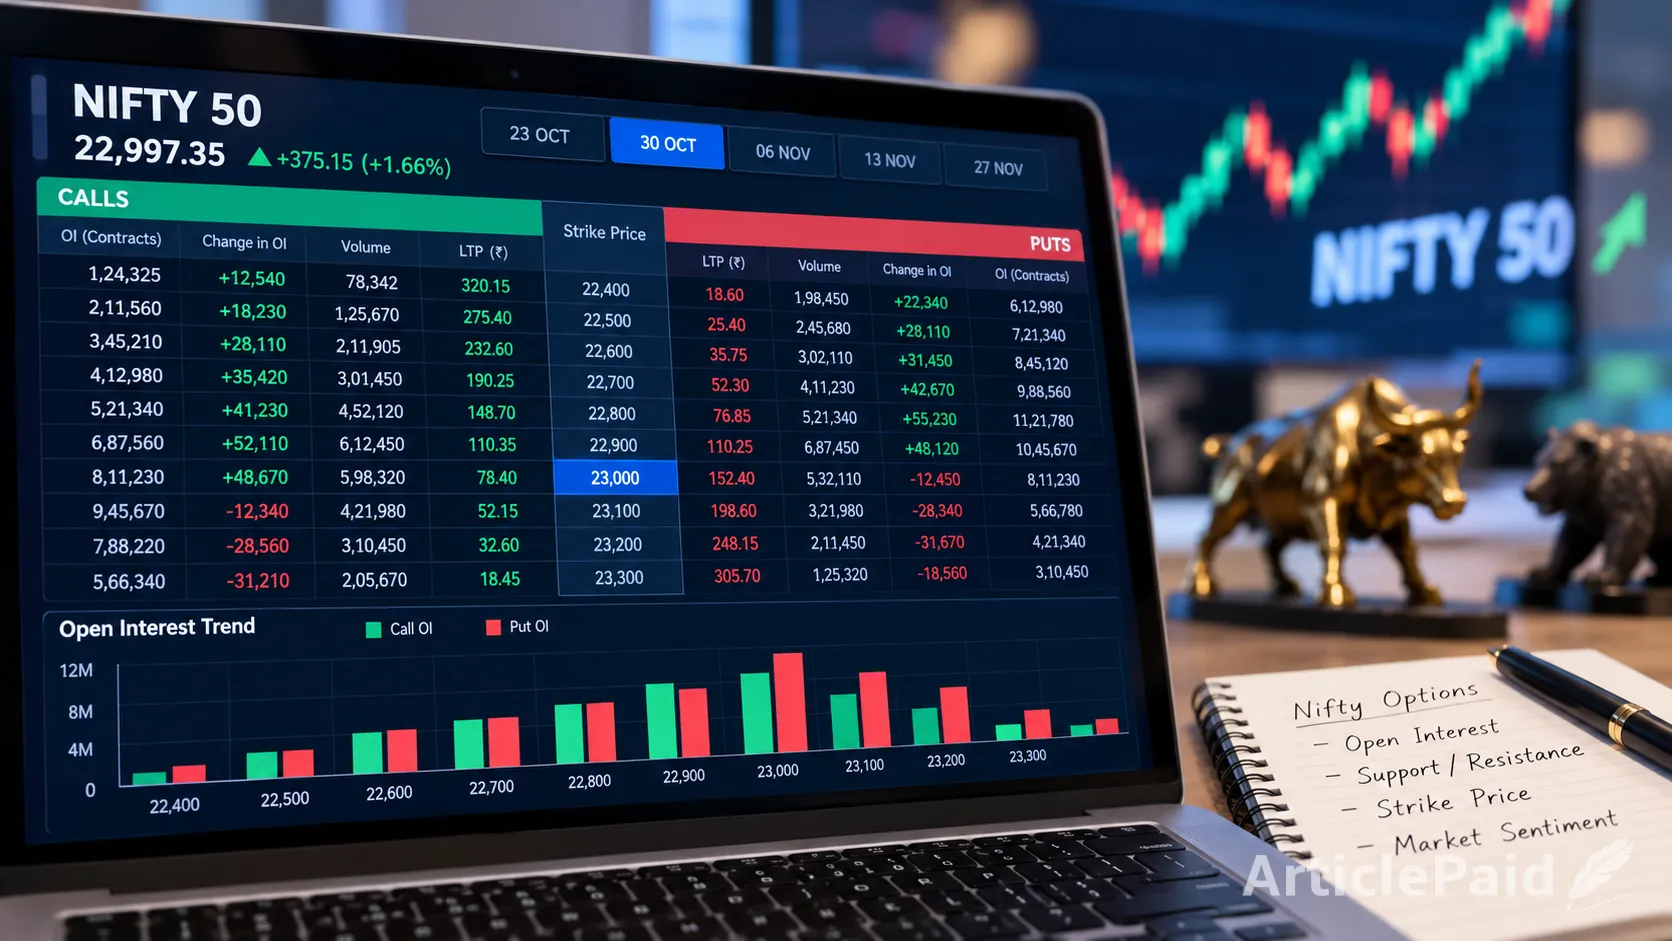
The Indian derivatives market has had plenty to digest this week. On October 15, the Nifty 50 jumped 1.66% to close at 22,997.35, marking its strongest single-session gain in four months. The rebound came amid changing global sentiment and buying in major Indian stocks. The following morning, the index moved higher again.
But a sharp rally doesn't automatically mean the next session will be easy to trade. When prices move quickly, it becomes even more important to understand what is happening beneath the index chart.
One development worth watching is SEBI’s October 15 decision to change the expiry-day settlement process for derivatives. From December 7, expiring index and stock derivatives will again use the volume-weighted average price of the final 30 minutes of regular trading to determine settlement prices. The regulator's decision followed concerns about sharp, erratic movements around the closing auction.
For anyone trading Nifty options, this is a good reason to revisit the basics of the options chain and open interest.

SEBI building alongside a Nifty 50 market chart illustrating India's derivatives market update.
Why the options chain deserves a closer look
An options chain displays available call and put contracts across different strike prices and expiry dates. Depending on the platform, it also shows premiums, trading volume, implied volatility, and open interest.
It can look intimidating at first. In practice, you don't need to study every number on the screen. Start with the strikes closest to the current Nifty level, then compare activity across calls and puts.
Open interest, usually abbreviated as OI, represents the number of outstanding derivative contracts that have not been closed, exercised, or otherwise settled. Unlike trading volume, which measures contracts traded during a period, OI tells you how many contracts remain open.
That difference matters. A strike with heavy trading volume may be attracting short-term interest, but a large OI figure shows that many contracts remain outstanding. Neither figure, by itself, tells you whether the market must move up or down.
How to read open interest without jumping to conclusions
Traders often watch call OI at higher strikes and put OI at lower strikes to identify possible resistance and support zones.
For example, if substantial call OI builds around a strike above the current Nifty level, traders may treat that area as potential resistance. A concentration of put OI below the index may be viewed as a possible support zone.
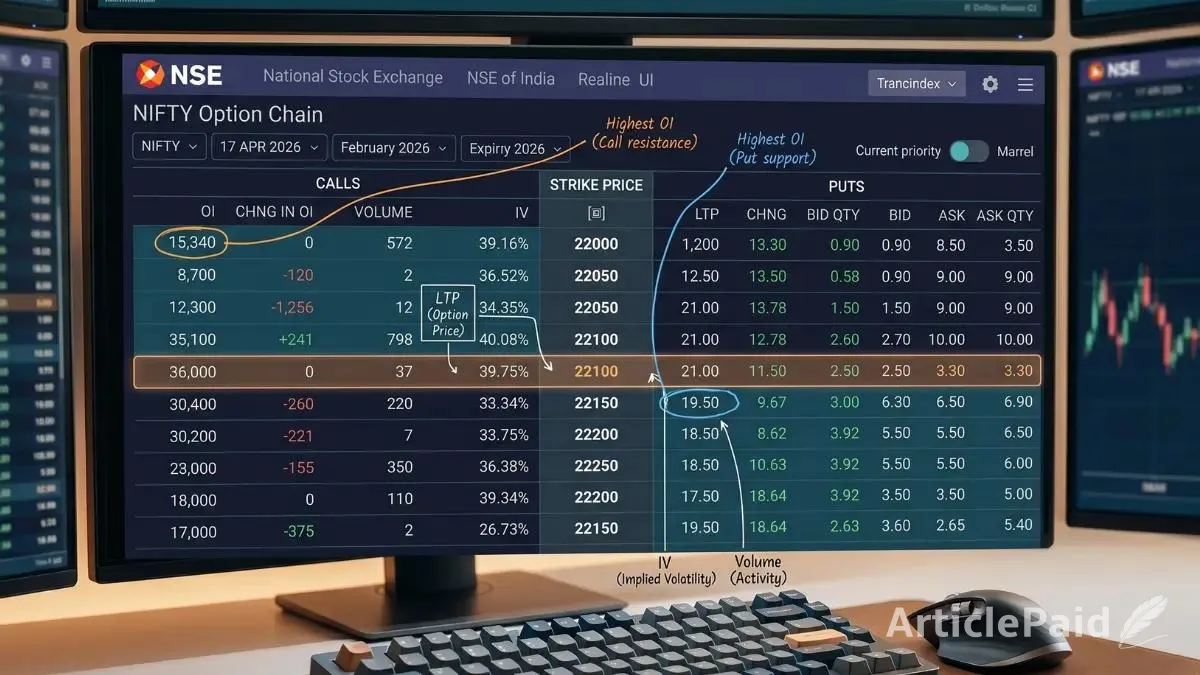
Nifty options open interest chart illustrating call and put positions across strike prices and potential support and resistance zones.
These are useful reference points, not guaranteed barriers.
The next step is to look at the change in OI alongside price movement. Rising OI means outstanding positions are increasing; falling OI means positions are being reduced overall. But OI data alone cannot identify every participant's intention or establish whether all new positions are bullish or bearish.
A falling resistance zone can also change the picture. If the index moves above a heavily watched strike while call OI starts declining there, traders may interpret that combination as a sign that the earlier resistance is weakening. It still needs confirmation from price action and other market information.
For readers who want to explore the figures themselves, this guide to Nifty open interest and market data is a useful starting point.
Why SEBI’s expiry-day changes matter
Expiry sessions can behave differently from ordinary trading days. Option premiums may change rapidly as the index moves, time value erodes, and traders adjust positions close to settlement.
SEBI's latest decision addresses the way expiring derivatives are settled, rather than changing what open interest means. Still, the change is relevant to anyone interpreting late-session price movements.
A sudden move near the close should not automatically be treated as evidence that a support or resistance level has broken decisively. Traders need to distinguish ordinary market activity, position adjustments, and settlement-related effects.
The December 7 implementation date also gives market participants time to understand the revised arrangements and check their broker's communications about expiry-day procedures.
A practical routine for reading Nifty options data
Before drawing a conclusion from the options chain, check a few things:
Start with the index chart. Identify the prevailing trend and the nearest important price levels.
Compare nearby strikes. Look at call and put OI, along with changes in OI, rather than relying on the largest number on the screen.
Check volume and volatility. A busy strike does not necessarily signal a directional move, and changes in implied volatility can affect option premiums independently of the index.
Watch how price reacts. A level matters more when price action supports the interpretation.
Recheck the data. OI changes throughout the session, so an observation made in the morning may no longer hold later in the day.
The broader lesson is fairly simple: the options chain is a tool for understanding positioning, not a crystal ball. SEBI’s latest settlement decision is a reminder that market mechanics matter, especially around expiry.
A trader who combines Nifty options data with price action, volatility, and sensible risk management is better equipped to assess the market than someone who trades solely on a single OI figure. And when the market is moving sharply, patience can be just as valuable as a good chart.
Disclaimer: This article is for educational purposes only and should not be considered investment advice or a recommendation to buy or sell any derivative contract. Options trading carries substantial risk.






















Responses (0)
Sign in to share your thoughts.
Sign in